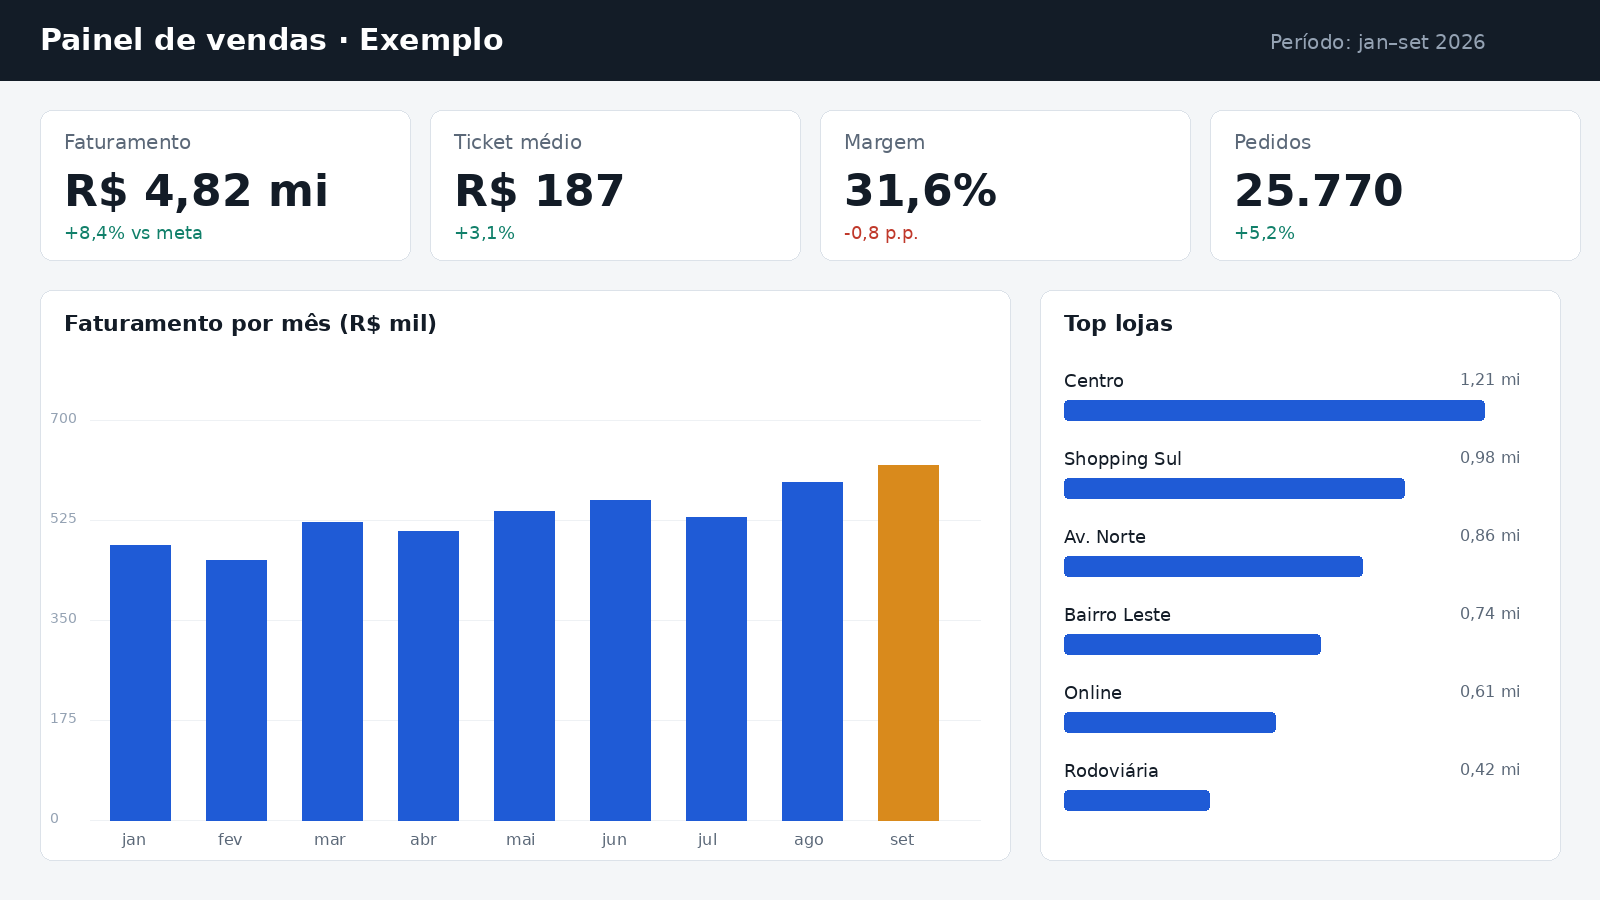
Retail sales dashboard Example
Tracks revenue, average ticket and margin by store and category, against monthly targets.
- Power BI
- DAX
- SQL
Data Analyst
I work with data analysis and Business Intelligence: I understand the business question, organize and model the data, and deliver clear dashboards that people actually use. Here you'll find my projects and what I'm currently studying.
Tracks revenue, average ticket and margin by store and category, against monthly targets.
Exploratory study of the factors that lead customers to cancel, with segmentation and recommendations.
Dashboard built on open government data to track economic indicators by state.
Before opening any tool, I agree with the people who will use the dashboard on which decision it needs to support.
I map the sources, fix inconsistencies and build a simple, documented model.
I pick a few metrics, the right chart for each one and a layout that can be read in seconds.
After delivery, I watch how the dashboard is used and change whatever isn't helping.
Como usar WITH para quebrar uma consulta grande em etapas com nome, e quando isso ajuda de verdade.
Um dashboard começa numa frase, não num gráfico. Três perguntas que eu faço antes de criar qualquer visual.
I'm open to projects, job opportunities and conversations about data.