← Projects
Dashboard · Example
Retail sales dashboard
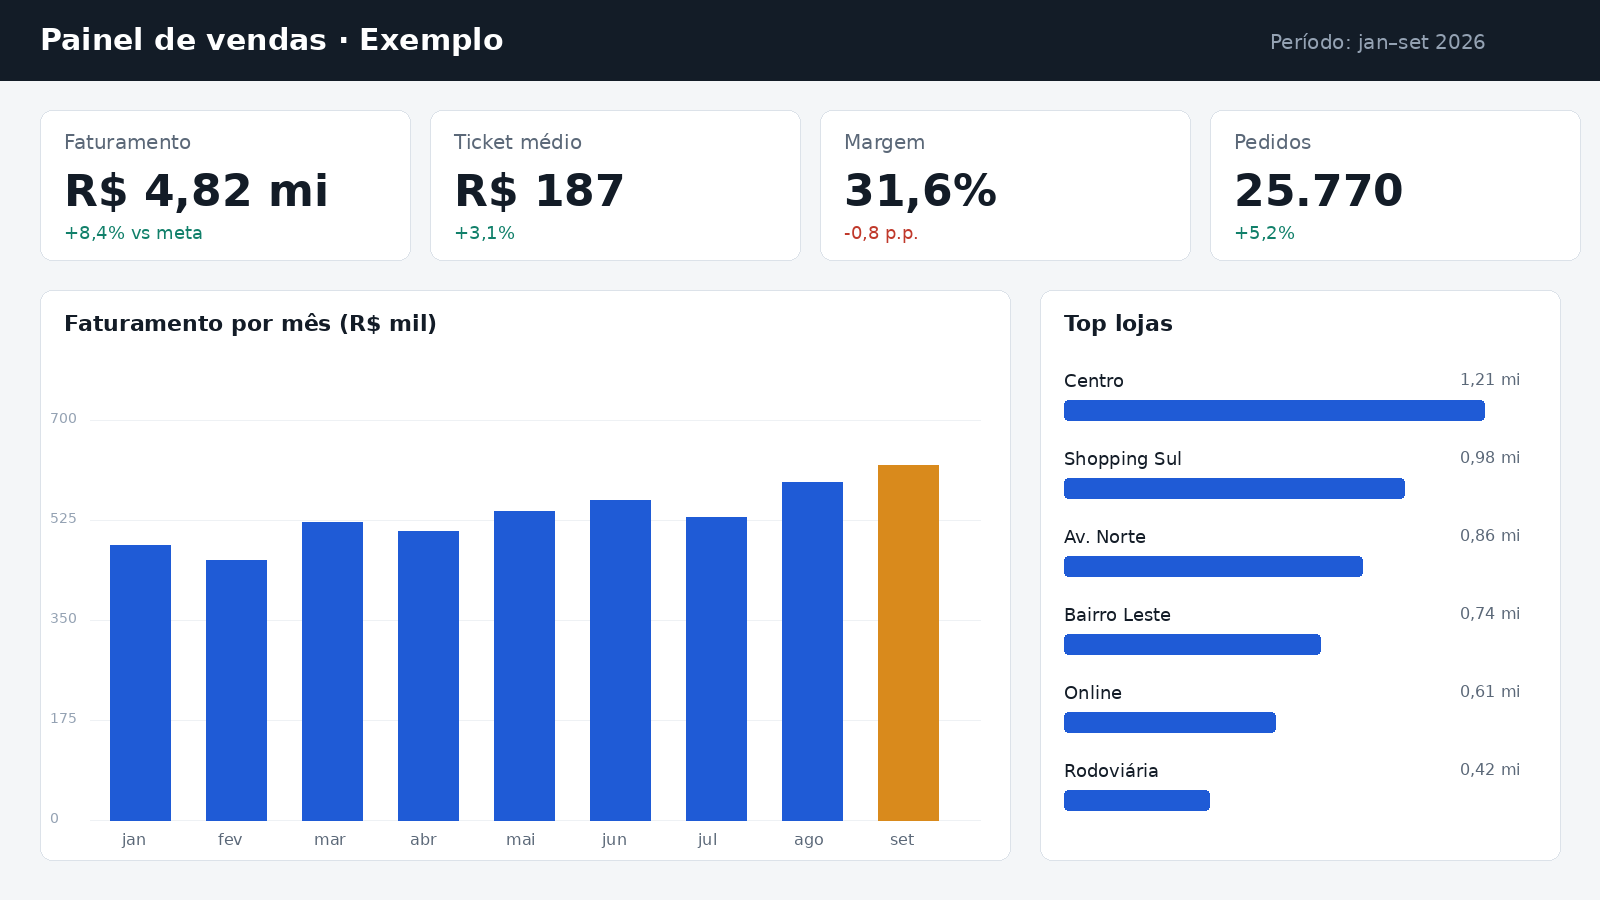
Tracks revenue, average ticket and margin by store and category, against monthly targets.
- Power BI
- DAX
- SQL
The problem
The sales leadership received different spreadsheets from each store and took days to close the monthly results.
What I did
- Consolidated sales from 3 systems into a star schema in SQL Server.
- Built DAX measures for revenue, average ticket, margin and variance against target.
- Designed an overview page and a store detail page, with filters by period and category.
Result
Monthly closing now happens on the first business day, and store managers track their targets daily.
Replace this text with your real project. A good structure is always: problem, what you did, result.